
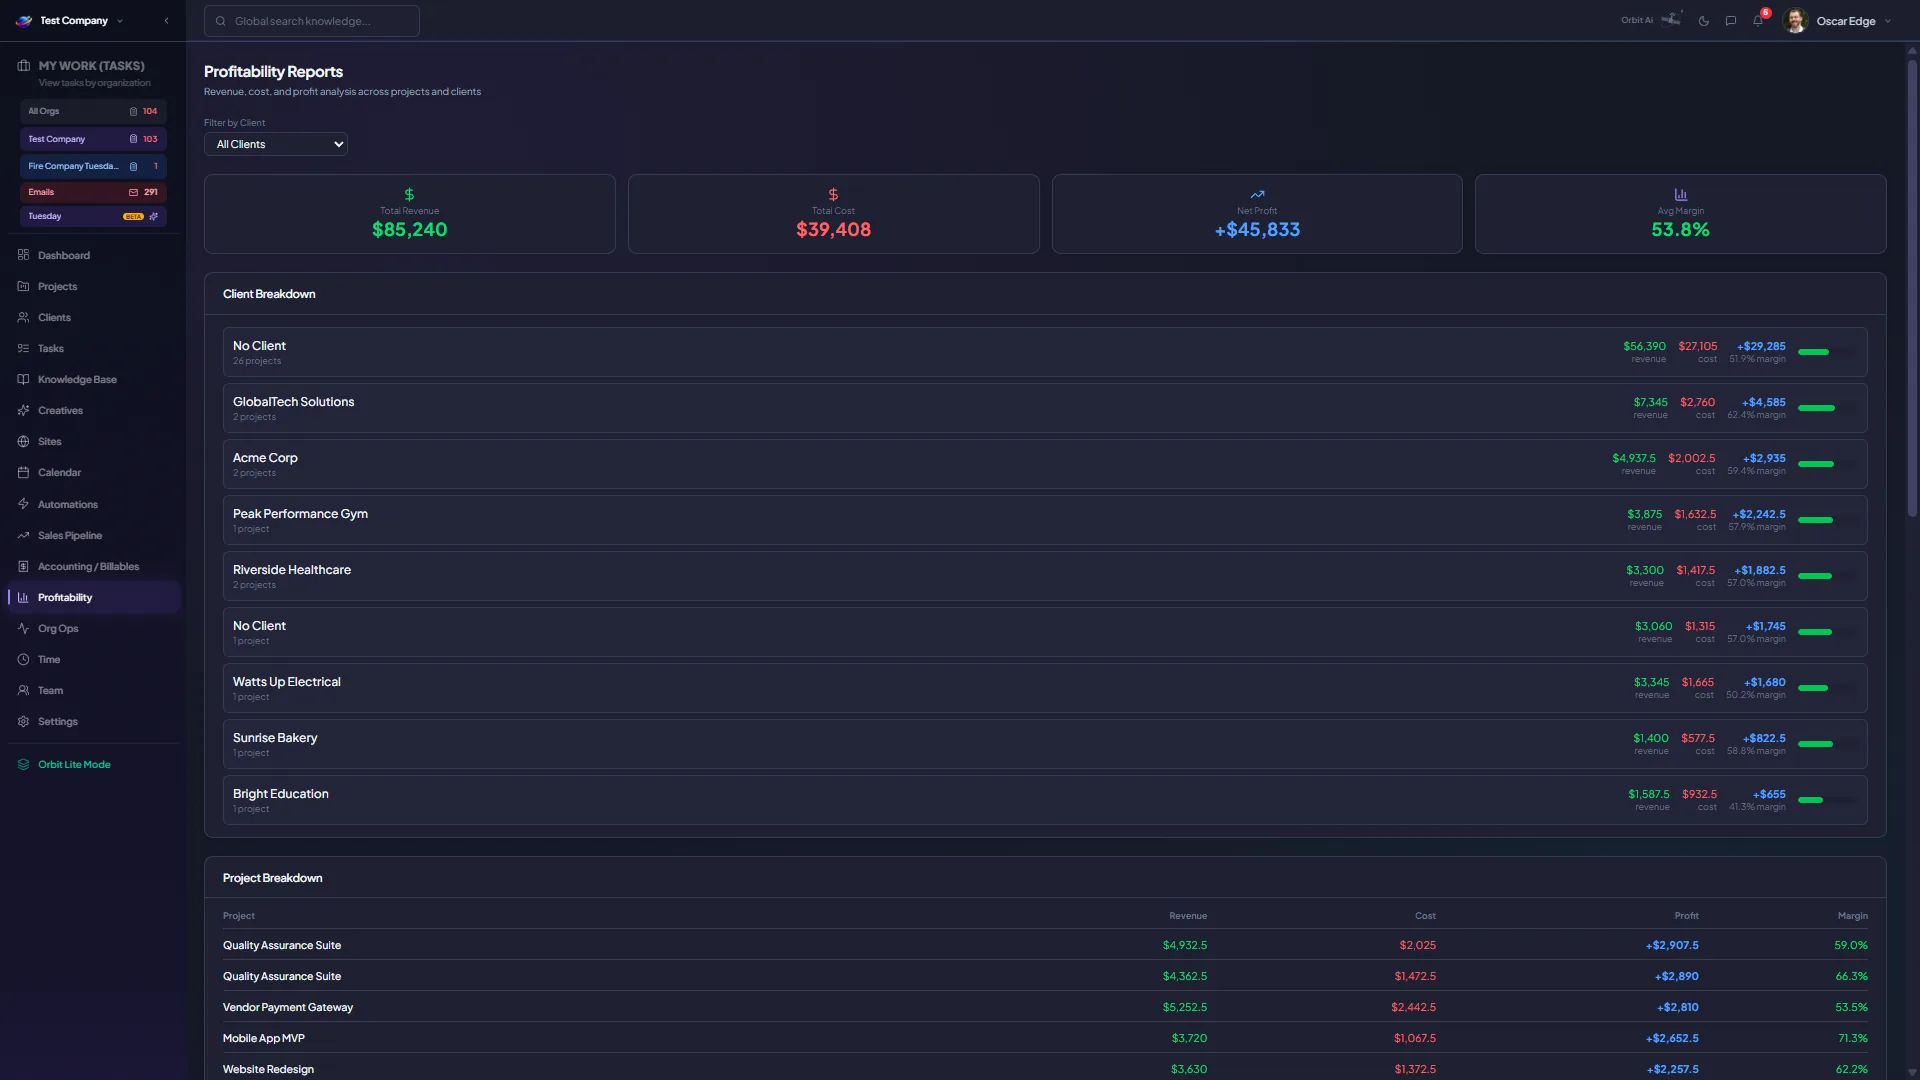
Know your margin on every client and project.
Revenue, expenses, net profit, and margin percentage broken down by client and by project — updated in real time as time is logged and invoiced. See where you grow, and where you renegotiate.
Who it's for
- MSP owners pricing new agreements
- Service managers identifying loss-leader clients
- Finance teams reporting margin by service line
- Account managers choosing where to expand
The problem it solves
Top-line revenue is easy. Margin is hard — and most service businesses guess. Loss-leader clients hide inside big revenue numbers. Pricing decisions get made on instinct. Year-over-year, the same accounts quietly eat margin.
The flow, end to end
Cost roll-up from time
Loaded technician cost + overhead allocation + parts/pass-through assemble automatically per project.
Revenue tie-in from invoicing
Invoiced revenue ties back to the underlying tickets, projects, and agreements.
Margin per dimension
Slice by client, project, agreement, technician, or service line — drill into the underlying records.

What teams actually get
The specific outcomes service teams see when they put Profitability to work.
- Spot unprofitable clients before they drain you
- Re-price retainers at renewal with real data
- Justify hiring with utilization and margin trends
- See in-progress margin, not just post-mortem
A typical run-through
- 1.Open the per-client profitability view.
- 2.Sort by margin ascending — the bottom 20% surface immediately.
- 3.Drill into a client; the projects driving low margin appear.
- 4.Decision: re-price at renewal, expand scope, or churn intentionally.
Map this module to your workflow
Get a guided walkthrough of Profitability Reporting tailored to your team, your client mix, and the tools you're replacing.
Pick a 15-min slot · No commitment required